Appendix E - How to configure Epilog for DNS Logs
Configuring Microsoft 2003 DNS Debug Logging
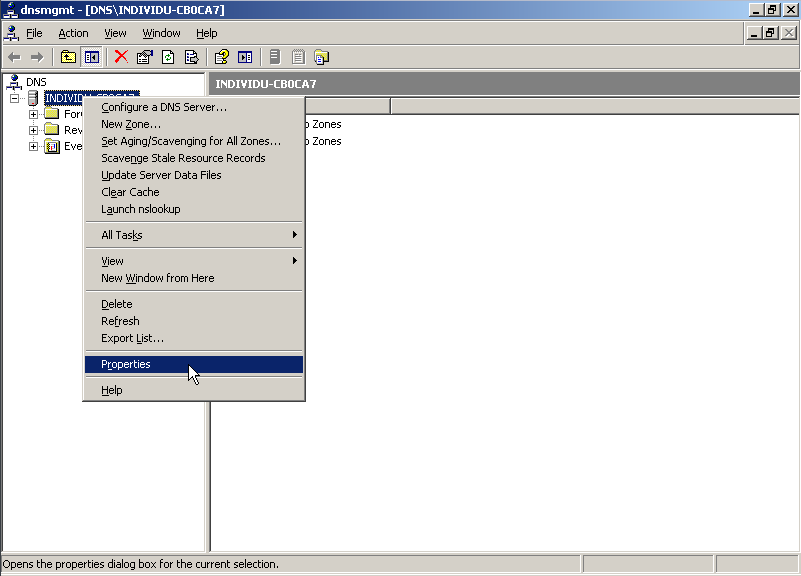
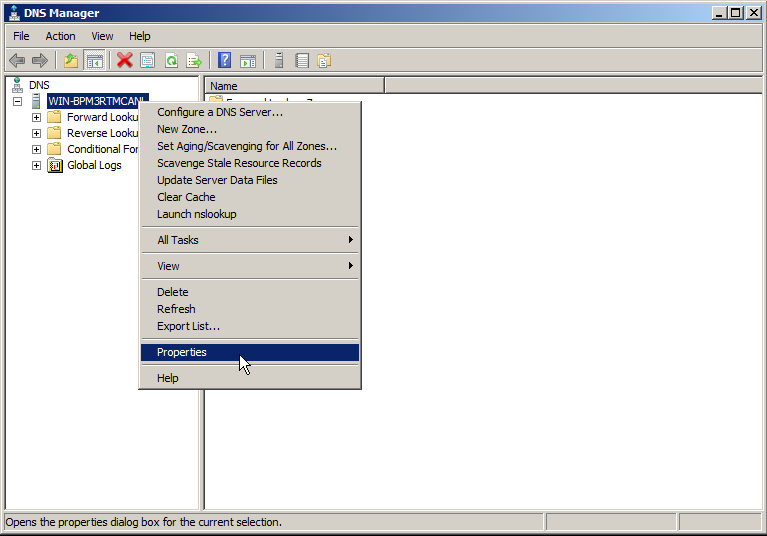
1. Click Start > Programs > Administrative Tools > DNS.
2. Now that you have the DNS management console open, right-click on your DNS server and select "Properties ".
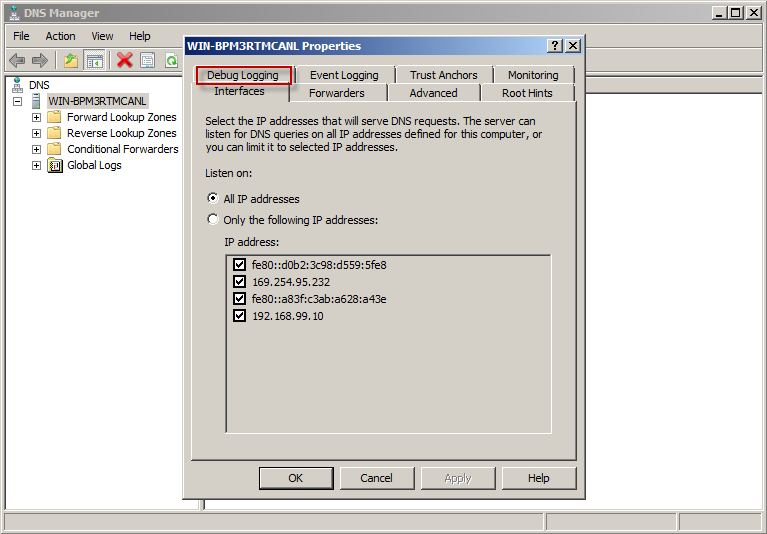
3. Now that you have the properties open for your DNS server select "Debug Logging
".
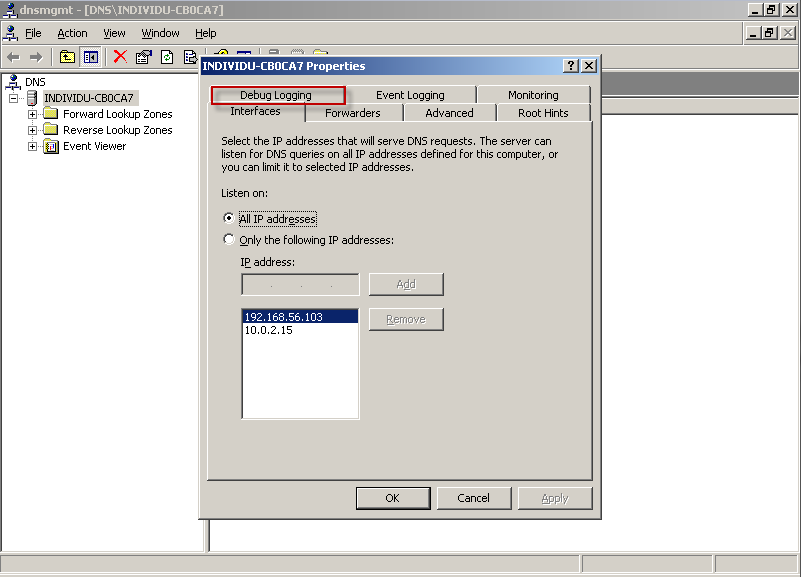
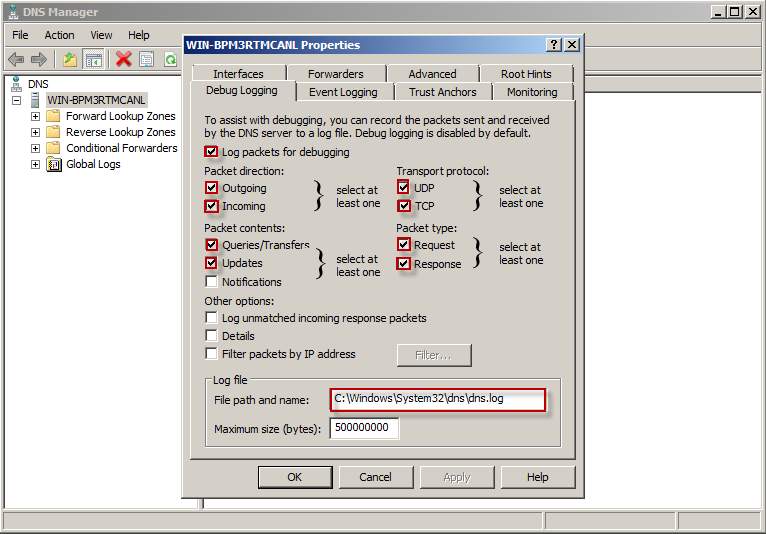
4. Here we will enable debug logging for DNS packets by selecting "Log packets for debugging" and selecting the following fields.
Packet direction: Outgoing, Incoming
Transport protocol: UDP, TCP
Packet contents: Queries/Transfers, Updates
Packet type: Request, Response
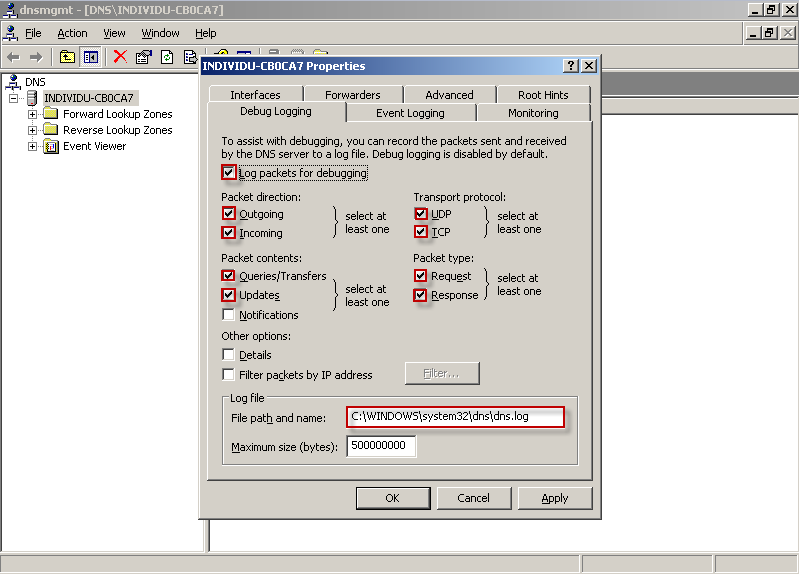
5. While still on the "Debug Logging" tab you will need to define your "Log file" . The default directory for this log file is C:\WINDOWS\system32\dns\dns.log
Your log file path may be different due to diskspace,etc. If this directory is different than the default directory, please make note as this will be needed later when configuring Enterprise Epilog.
6. Select "Apply" and "OK" to save your changes and proceed to section 7 "Enterprise Epilog Log Configuration".
Configuring Microsoft 2008/2012 DNS Debug Logging
1. Click Start > Programs > Administrative Tools > DNS.
2. Now that you have the DNS management console open, right-click on your DNS server and select "Properties" .
3. Now that you have the properties open for your DNS server select "Debug Logging" .
4. Here we will enable debug logging for DNS packets by selecting "Log packets for debugging" and selecting the following fields.
- Packet direction: Outgoing, Incoming
- Transport protoco: UDP, TCP
- Packet contents: Queries/Transfers, Updates
- Packet type: Request, Response
5. While still on the "Debug Logging" tab you will need to define your "Log file" . The default directory for this log file is C:\WINDOWS\system32\dns\dns.log.
Your log file patch may be different due to diskspace,etc. If this directory is different than the default directory, please make note as this will be needed later when configuring Enterprise Epilog.
6. Select "Apply" and "OK" to save your changes and proceed to section 7 "Enterprise Epilog Log Configuration".
Accessing Enterprise Epilog
Navigate to the Enterprise Epilog remote control interface available at All Programs | Intersect Alliance | Epilog for Windows
Adding Log Source
1. From the left-hand menu, select "Log Configuration "

2. Click the "Add " button at the bottom of the SNARE Log Configuration screen

3. Set the following parameters (example screenshot below):
a) "Select the Log Type ": Select <Custom Event Log > and enter MSDNSLog in the custom field.
b) In "Log File or Directory ", enter the directory where the DNS logs are stored. If you are unsure of your log path, see section 6 "Configuring Microsoft DNS" for assistance in determining the log directory.
c) In Log Name Format enter the log file format if necessary, and select All Matching Files.
d) Leave all other settings as their default
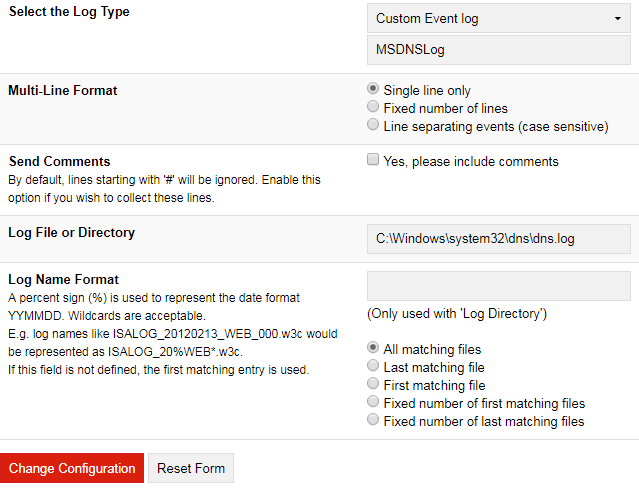
4. Once you have filled in the appropriate fields, click the "Change Configuration" button.
5. In the left-hand menu, click "Apply the Latest Audit Configuration " and hit the "Reload Settings " button in the main screen.

6. You will be redirected to status screen once changes are applied

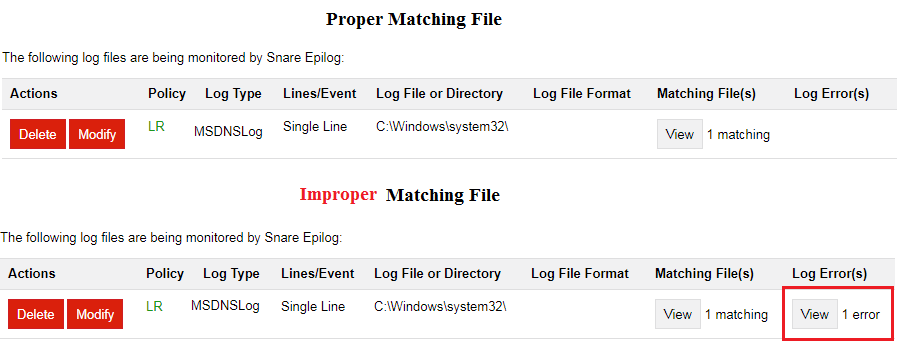
Review your log configuration and make sure the "Matching File" is black and not red . A filename in black indicates that Enterprise Epilog has found the current file for processing. A filename in red indicates that Enterprise Epilog cannot find the file for processing.
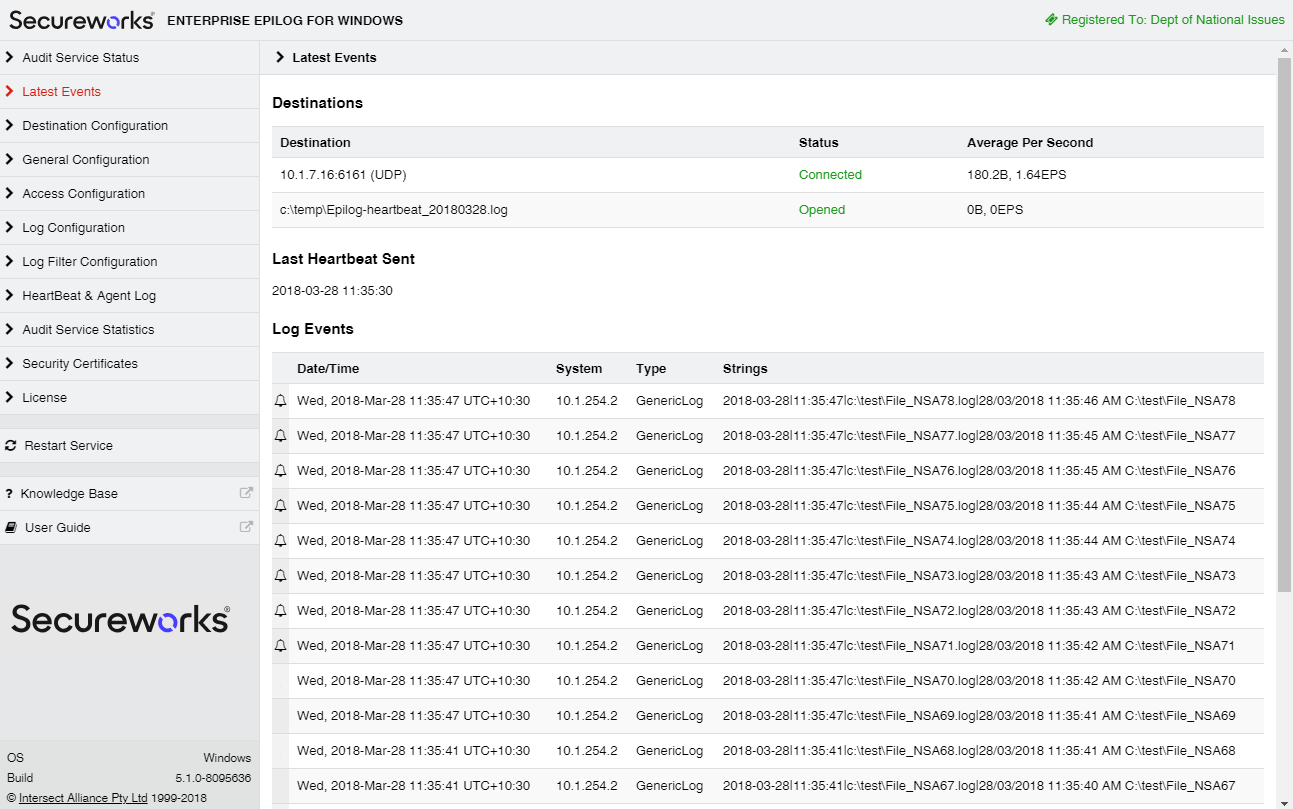
Verify Current Events
Events collected by the Enterprise Epilog agent will be displayed in the 'Latest Events' window of the Remote Control Interface. This display is NOT a display from the text-based log file, but rather a temporary display from a shared memory connection between the Enterprise Epilog remote control interface and the Enterprise Epilog service. The Enterprise Epilog remote control interface will begin with a clear event log, since fevents are not written to a local disk during normal operations. A key feature of the Enterprise Epilog service is that events are not stored locally on the host (except for the log files being monitored by Epilog), but rather sent out over the network to one or more CTA/LogCollectors.
Please note: If caching is enabled, messages will be written to disk when the agent is stopped to prevent lost messages. This file is read into memory and removed as soon as the agent is restarted.
A summary version of the events is displayed on the 'Latest Events' window. The 'Latest Events' window is restricted to a list of 20 entries and cannot be cleared, except by restarting the agent. The status of the current network connection(s) to the CTA/LogCollector is also displayed on this screen. The window will automatically refresh every 30 seconds.
Review your "Current Events" once you are sure you have a proper matching file(s) to insure the contents of the file are being processed. Seeing events in the "Current Events" area usually means that Enterprise Epilog is transmitting the logs to the specified destination.
Note: You may see events with/without Bell. The events with Bell indicates that they are the most recently processed entries.