Appendix F - How to configure Epilog for IIS Logs
Configuring Microsoft IIS6
1. Click Start > Programs > Administrative Tools > Internet Information Services (IIS) Manager.
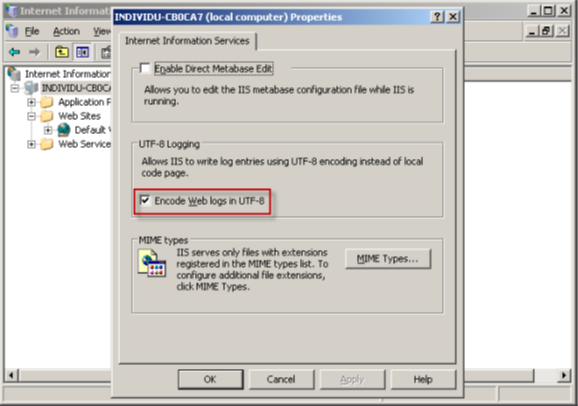
2. To determine your log file encoding type right click your server and select properties. If you have UTF-8 encoding enabled the check box for “UTF-8 Logging” will be checked. The default is unchecked which is ANSII encoding. Snare supports either UTF-8 or ANSII encoding
3. Now navigate to the Web Sites folder. Expand the Web Sites folder and select your site for monitoring. Right click the site and select properties.
Validate that you have logging enabled for the site and if not select “Enable logging” to enable logging.
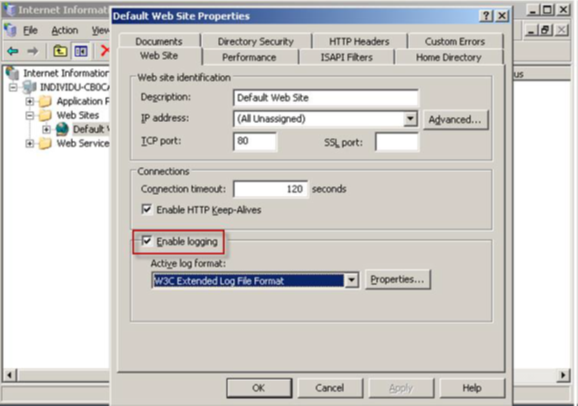
5. Now that you have verified and or enabled logging for the site make sure the “Active log format” is “W3C Extended Log File Format”. (See above screenshot for example)
6. While still on the same screen click the Properties button for the “Active log format” to view the log directory, log schedule and rollover settings.
7. Here you will find your “Log file directory” settings. Notice the numerical value in the “Log file name”. This is the site ID number for the site which is added as a suffix to the log directory. Note: your log schedule, rollover and log file directory may be different from the below screenshot as this is our suggested default configuration
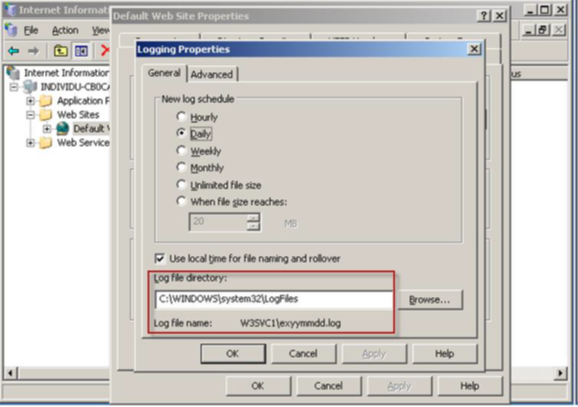
8. Now that you have defined and or verified your log schedule, rollover and log file directory select the “Advanced” tab at the top.
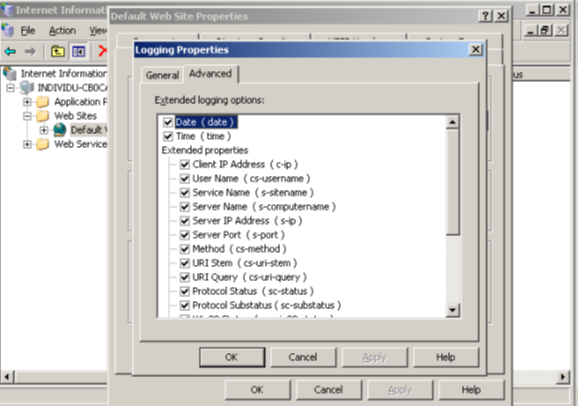
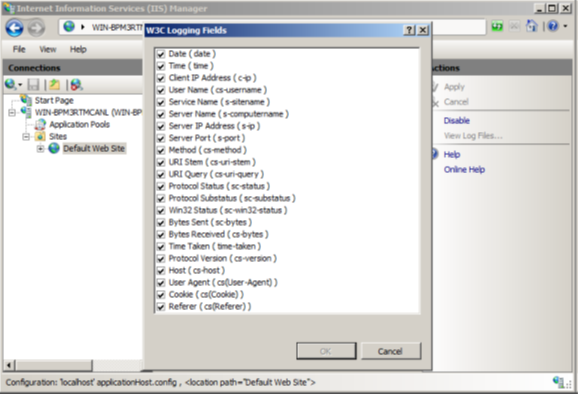
Here we need to verify that the proper log flags are defined. Not having the required log flags defined could result in missed security events. Make sure you either select all of the log flags or at a minimum the following log flags MUST be selected.
Date, Time, ClientIP, UserName, ServerIP, ServerPort, Method, UriStem, HttpStatus (Protocol Status), UserAgent
The following are the flags set by default:
Date, Time, ClientIP, UserName, ServiceName, ServerIP, ServerPort, Method, URIStem, URIQuery, HttpStatus (Protocol Status), Protocol Substatus, Win32 Status, User Agent
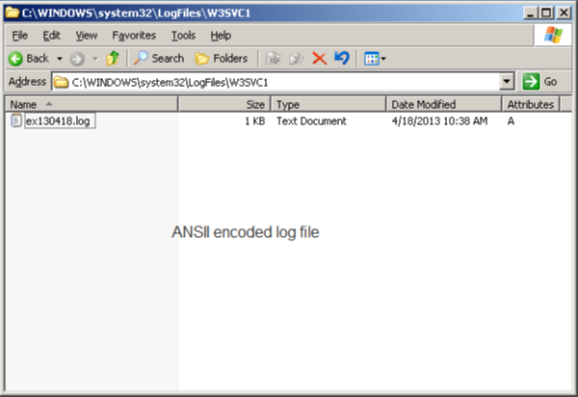
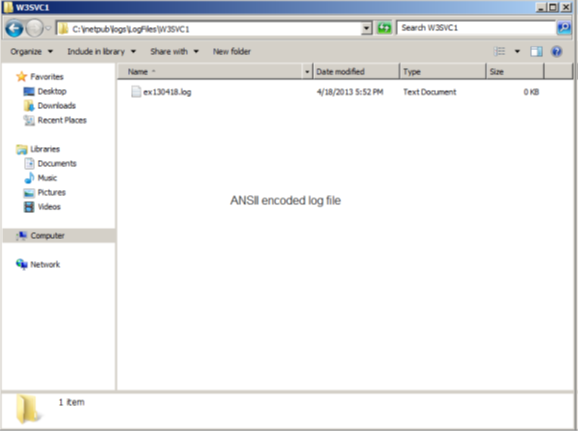
9. Now that you have configured logging and or verified logging for your monitored sites you may want to view the log in their directory. Here are some examples of what the logs will look like. Note: if you do not see any logs files in the log directory/directories it could be due to no traffic/users accessing the site(s). You may want to browse the site(s) to generate traffic so logs are produced. Also note that it can sometimes take a minute before IIS updates the log file.
10. Now that you have completed the configuration and or verification process for IIS, please configure the epilog agent to point to the log location.
Configuring Microsoft IIS7/IIS8
1. Click Start > Programs > Administrative Tools > Internet Information Services (IIS) Manager.
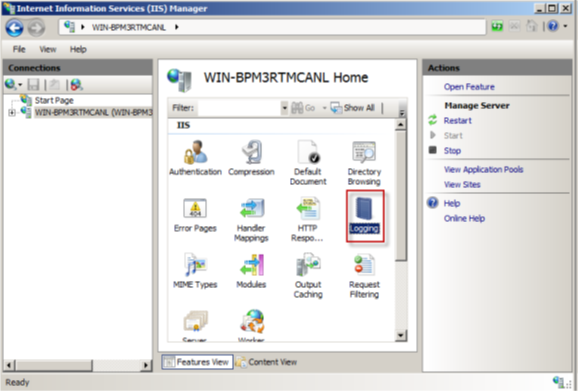
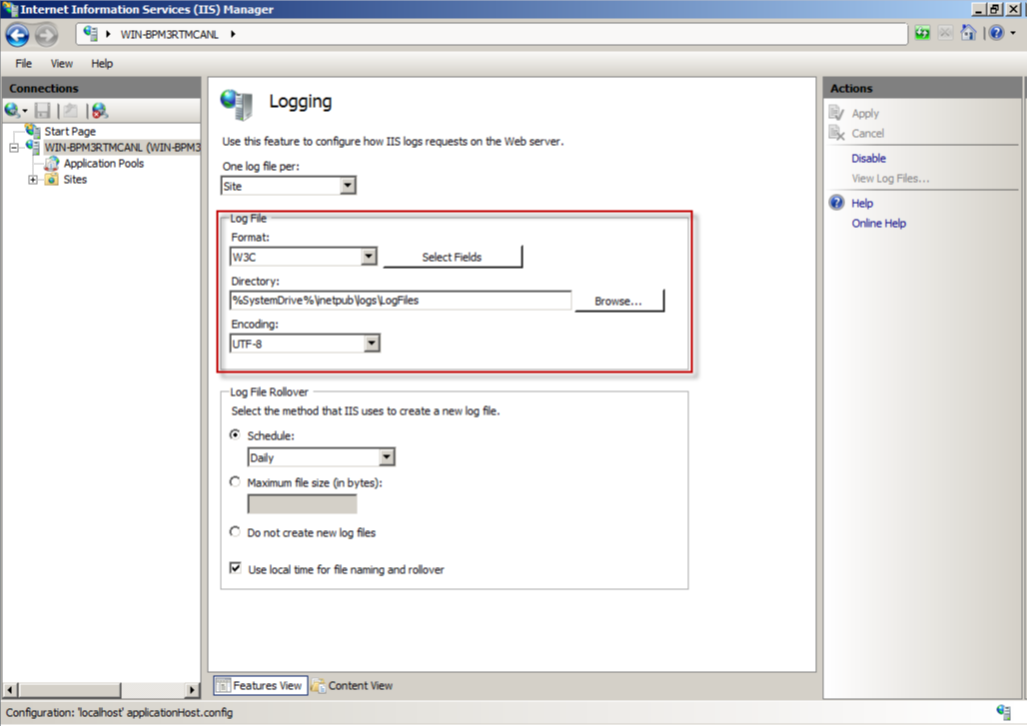
2. To determine your global logging settings and log file encoding type select your server and in the middle pane double click "Logging".
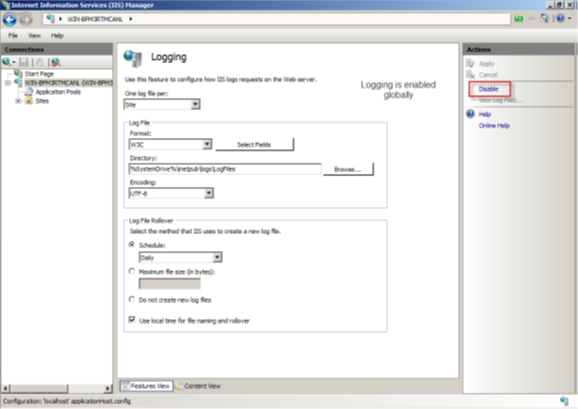
3. Verify and or enable logging globally for the server. Our examples here assumes you are using one log file per Site. If you have logging Enabled globally the fields in the middle pane will not be greyed out and the “Action” “Disable” should be blue. If logging is disabled the fields will be greyed out and the “Action” “Enable” should be blue.
Logging enabled globally example
If you make a configuration change, make sure to “Apply” the change!
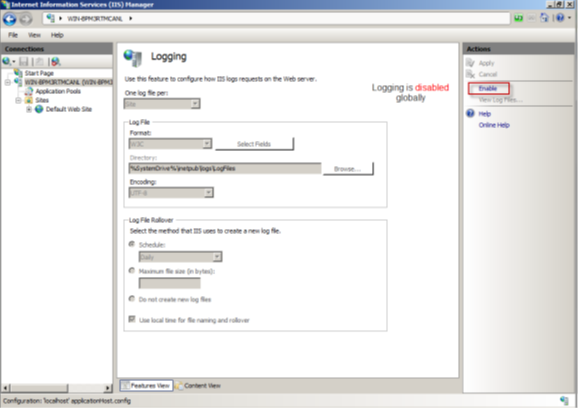
Logging disabled globally example
If you make a configuration change, make sure to “Apply” the change!
4. Now that you have verified and or enabled logging globally lets verify and or configure your log format and encoding globally. The default log file format for IIS7/IIS8 is W3C and the default encoding is UTF-8. Your current global implementation may be set differently and that is fine. This can be changed at the site level if you have the need to log in a different format for other sites.
If you make a configuration change, make sure to “Apply” the change!
5. Now navigate to the Sites folder. Expand the Sites folder and select your site for monitoring. Then in the middle pain double click “Logging”.
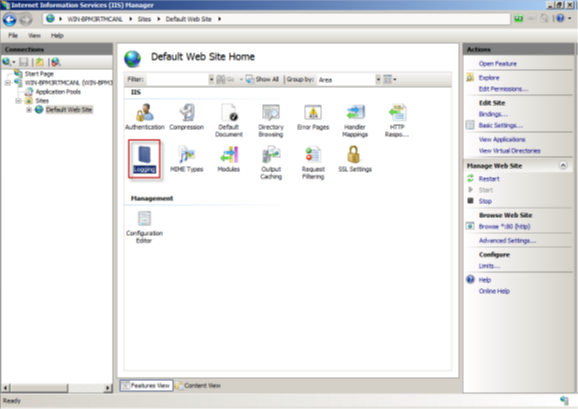
6. Now that you have the logging settings open for the site verify and or enable logging for the site as you did for your global settings.
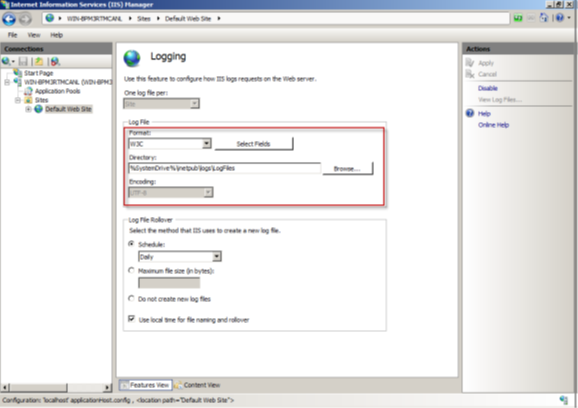
7. Make note of your configured “Directory” as this is where you will find your site’s log directory and access logs.
8. Verify and or configure the “Log File” format as “W3C”. The “Encoding” should be UTF-8 or ANSII. In the below example you can see that the encoding was inherited from the global settings and is defined as UTF-8. Note: Your options for “Log File Rollover” may be different than the below example as this is our suggested default configuration.
If you make a configuration change, make sure to “Apply” the change!
9. Now that you have defined and or verified your log schedule, rollover and log file directory click the “Select Fields” button by the Log File “Format” drop down.
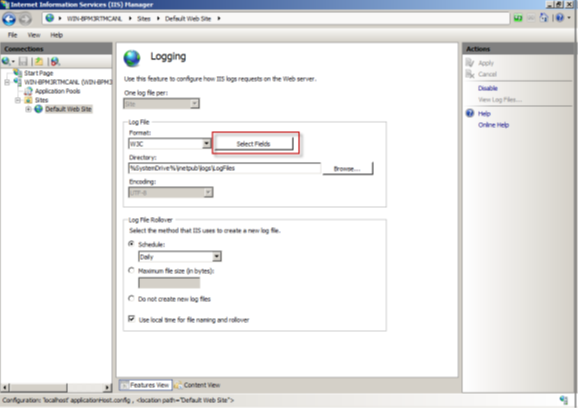
10. Here we need to verify that the proper log flags are defined. Not having the required log flags defined could result in missed security events. Make sure you either select all of the log flags or at a minimum the following log flags MUST be selected.
Date, Time, ClientIP, UserName, ServerIP, ServerPort, Method, UriStem, HttpStatus (Protocol Status), UserAgent
The following are the flags set by default.
Date, Time, ClientIP, UserName, ServerIP, ServerPort, Method, URIStem, URIQuery, HttpStatus (Protocol Status), Protocol Substatus, Win32 Status, Time Taken, User Agent
If you make a configuration change, make sure to “Apply” the change!
11. Now that you have configured logging and or verified logging for your monitored sites you may want to view the log in their directory. Here are some examples of what the logs will look like. Note: if you do not see any logs files in the log directory/directories it could be due to no traffic/users accessing the site(s). You may want to browse the site(s) to generate traffic so logs are produced. Also note that it can sometimes take a minute before IIS updates the log file.
First collect your site IDs so you know which log directory belongs to which site. You can do this by selecting the “Sites” folder on the left pane and the IDs will be listed in the middle pane.
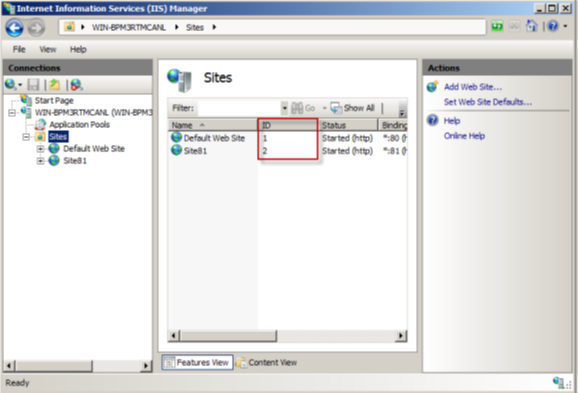
12. Now using the previous log path(s) for your site(s) you gathered, append W3SVC<ID#> to the log path and that will be your full path to the site’s access logs.

Accessing Enterprise Epilog
Navigate to the Enterprise Epilog remote control interface available at All Programs | Intersect Alliance | Epilog for Windows.
Adding Log Source
1. From the left-hand menu, select "
Log Configuration "
2. Click the "Add " button at the bottom of the SNARE Log Configuration screen.
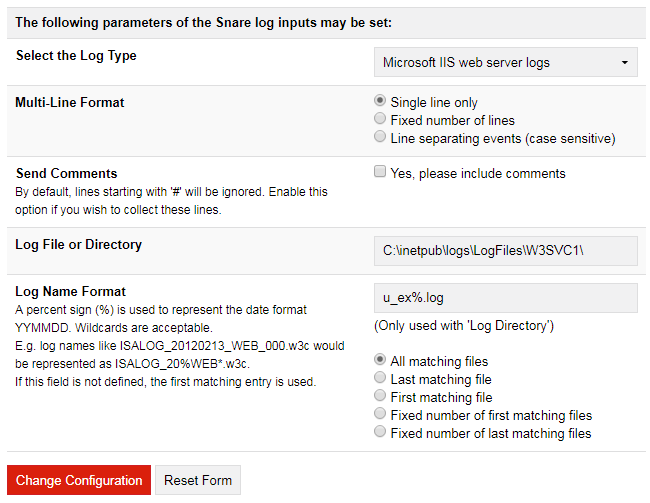
3. Set the following parameters (example screenshot below):
a) "Select the Log Type": Select <
Microsoft IIS web server logs >
b) In Log File or Directory, enter the directory where the IIS logs are stored. If you are unsure of your log path, see section 6 "Configuring Microsoft IIS" for assistance in determining the log directory.
i. Typically for IIS6: "
C:\WINDOWS\system32\LogFiles\W3SVC<site_ID#>\ "
ii. Typically for IIS7 and IIS8: "
C:\inetpub\logs\LogFiles\W3C\W3SVC<site_ID#>\ "
c) In Log File Format, enter the filename where your access logs are being written. For
ANSII encoding the filename will typically be ex%.log (the percent sign will automatically add the date format of YYMMDD; example result: ex130418.log). For UTF-8 encoding the filename will typically be u_ex%.log (the percent sign will automatically add the date format of YYMMDD; example result: u_ex130418.log). If you are unsure of your encoding type, see section 6 "Configuring Microsoft IIS" for assistance in determining your log encoding.
d) Leave all other settings as their default
Once these are set, click the
"Change Configuration” button.
4. Continue to add your log configurations until all running sites that will be monitored are defined.
Apply the Latest Audit Configuration
In the left-hand menu, click "Apply the Latest Audit Configuration " and hit the "Reload Settings " button in the main screen.
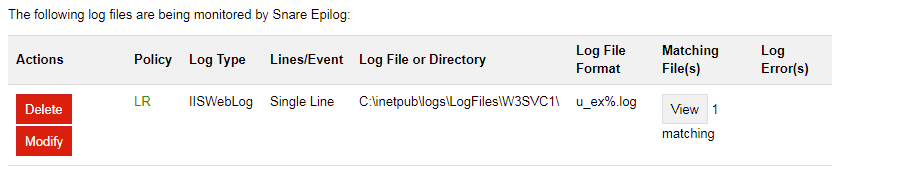
Verify Log Configuration
Review your log configuration and make sure the "Matching File" is
black and not red . A filename in black indicates that Enterprise Epilog has found the current file for processing. A filename in red indicates that Enterprise Epilog cannot find the file for processing.
Proper Matching File
Improper Matching File
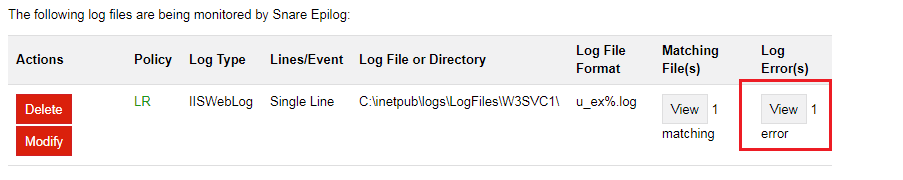
Verify Current Events
Events collected by the Enterprise Epilog agent will be displayed in the 'Latest Events' window of the Remote Control Interface. This display is NOT a display from the text-based log file, but rather a temporary display from a shared memory connection between the Enterprise Epilog remote control interface and the Enterprise Epilog service. The Enterprise Epilog remote control interface will begin with a clear event log, since fevents are not written to a local disk during normal operations. A key feature of the Enterprise Epilog service is that events are not stored locally on the host (except for the log files being monitored by Epilog), but rather sent out over the network to one or more CTA/LogCollectors.
Please note: If caching is enabled, messages will be written to disk when the agent is stopped to prevent lost messages. This file is read into memory and removed as soon as the agent is restarted.
A summary version of the events is displayed on the 'Latest Events' window. The 'Latest Events' window is restricted to a list of 20 entries and cannot be cleared, except by restarting the agent. The status of the current network connection(s) to the CTA/LogCollector is also displayed on this screen. The window will automatically refresh every 30 seconds.
Review your "Current Events" once you are sure you have a proper matching file(s) to insure the contents of the file are being processed. Seeing events in the "Current Events" area usually means that Enterprise Epilog is transmitting the logs to the specified destination.
Note: You may see events with/without Bell. The events with Bell indicates that they are the most recently processed entries.
