...
2. Click the "Add " button at the bottom of the SNARE Log Configuration screen


3. Set the following parameters (example screenshot below):
...
d) Leave all other settings as their default

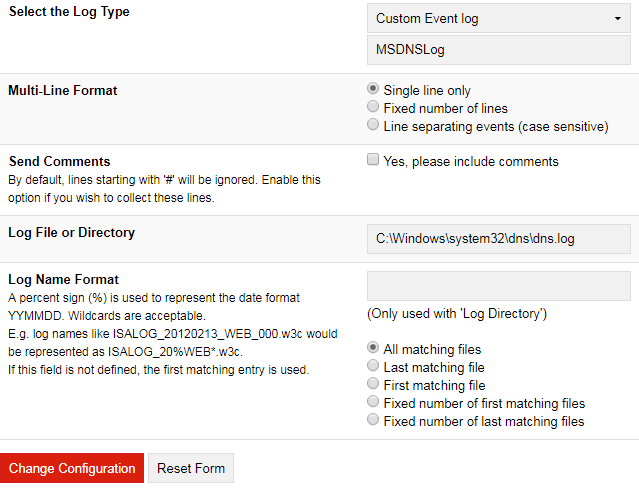
4. Once you have filled in the appropriate fields, click the "Change Configuration" button.
5. In the left-hand menu, click "Apply the Latest Audit Configuration " and hit the "Reload Settings " button in the main screen.


6. You will get the following confirmation: Snare Objectives have been applied to the running system. You will be redirected to status screen once changes are applied

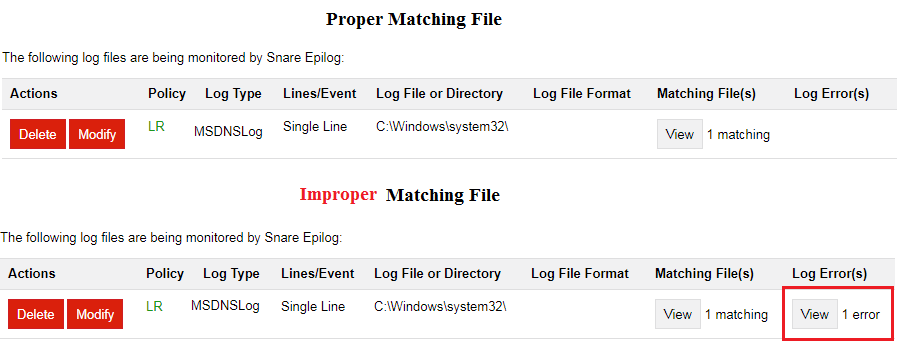
Review your log configuration and make sure the "Matching File" is black and not red . A filename in black indicates that Enterprise Epilog has found the current file for processing. A filename in red indicates that Enterprise Epilog cannot find the file for processing.
Proper Matching File

Improper Matching File

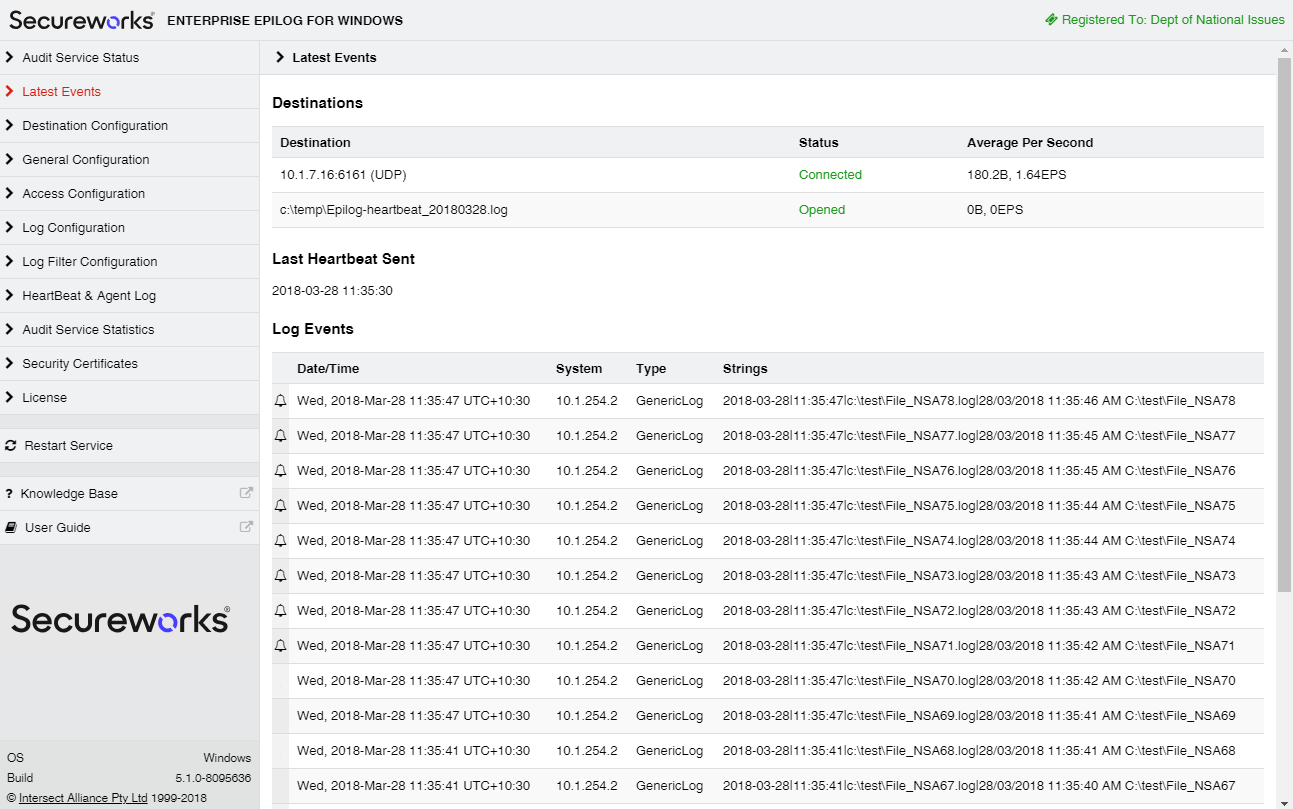
Verify Current Events
Events collected by the Enterprise Epilog agent will be displayed in the 'Latest Events' window of the Remote Control Interface. This display is NOT a display from the text-based log file, but rather a temporary display from a shared memory connection between the Enterprise Epilog remote control interface and the Enterprise Epilog service. The Enterprise Epilog remote control interface will begin with a clear event log, since fevents are not written to a local disk during normal operations. A key feature of the Enterprise Epilog service is that events are not stored locally on the host (except for the log files being monitored by Epilog), but rather sent out over the network to one or more CTA/LogCollectors.
...
Review your "Current Events" once you are sure you have a proper matching file(s) to insure the contents of the file are being processed. Seeing events in the "Current Events" area usually means that Enterprise Epilog is transmitting the logs to the specified destination.
Note: You may see events in green and events in grey/whitewith/without Bell. The events in green indicate with Bell indicates that they are the most recently processed entries.