There are several options and different types of logs for DNS Activity.
Collecting DNS logs is important for most security programs as they contain valuable information and assist with detecting malicious activity in a network from system or software connecting to rogue sites.
DNS Debug Logs
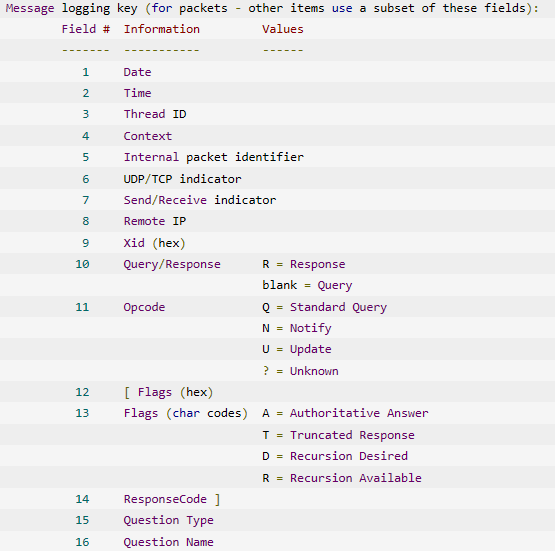
The DNS debug logs can contain valuable information on the request to a site and then look ups can occur to detect malicious sites, as in the Snare Central DNS reports assist with. The log contains the following structure of each DNS event.

The following describes how to enable DNS request logging for Windows 2003 and above, and how to configure Snare Enterprise Windows or Stand alone Epilog for Windows, so to collect DNS logs.
How to Collect DNS Logs with Snare Windows agent
Install the Agent following the Guide to Snare Windows or Epilog agent on the server that you would like to collect the DNS logs from to send to SIEM product.
How to Enable DNS Request Logging for Windows 2003 and above
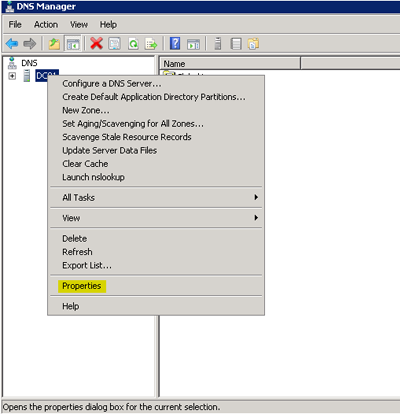
Open the Domain Name System Microsoft Management Console on the server that you installed the Snare agent on (DNS MMC) snap-in by going to Start, Programs, Administrative Tools, and then DNS Manager.
From the DNS Server, right-click the server and select the Properties submenu.

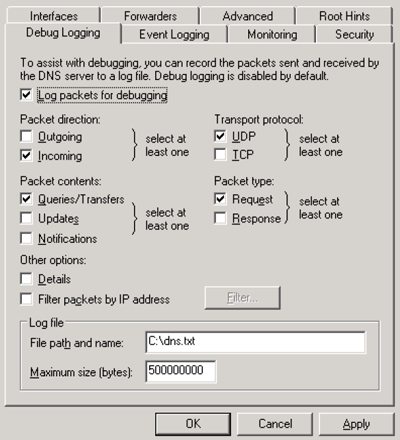
3. The Properties pop-window will appear on your screen.
4. Select the Debug Logging tab and the Log packets debugging check box, respectively.
5. Ensure that the Incoming, UDP, Queries/Transfers, and Request check boxes are selected.
6. Specify the log path and name in the File path and name box. NOTE: To ensure that the server's drive does not exceed capacity, it is recommended that the file be placed on a drive with enough space with a max file size between 500MB and 1GB.

7. Click the OK button.
How to Configure the Windows Agent
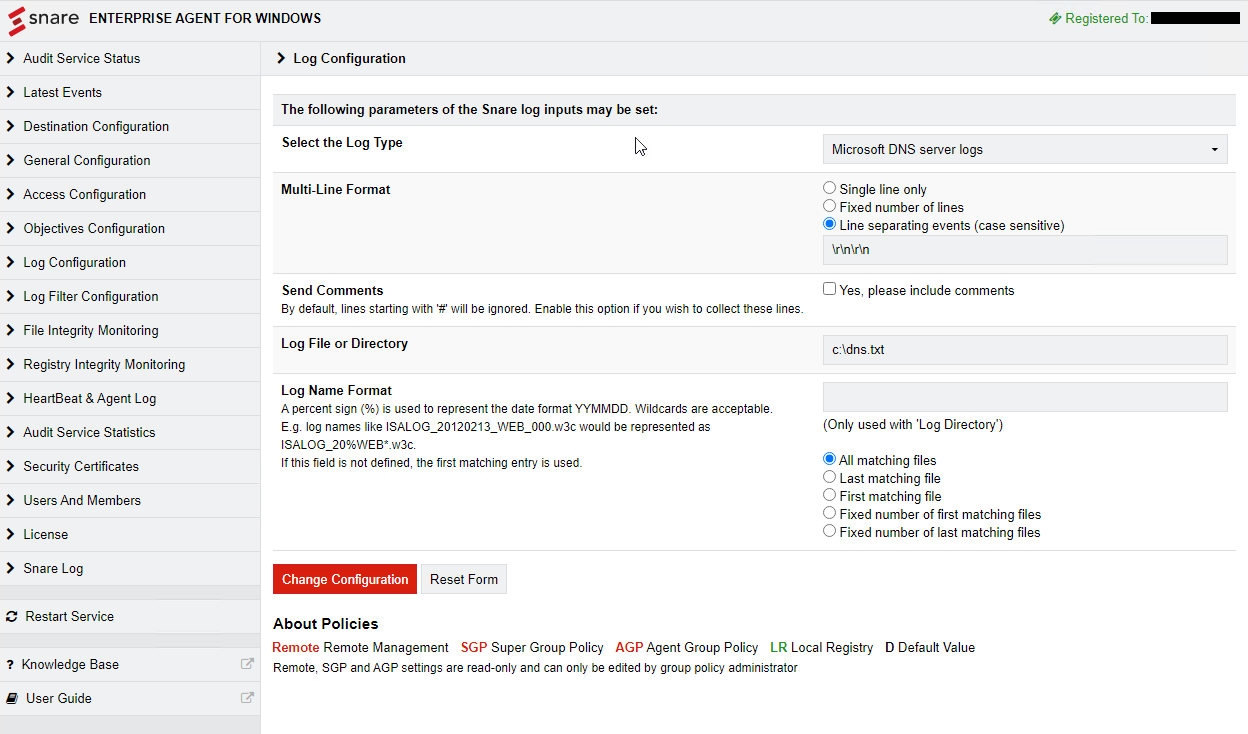
Login to Snare Windows Agent web interface.
Select the Log Configuration from the list on the left side of the screen.
select the Add button
From the drop down under Select the Log Type choose Microsoft DNS Server logs.
In the section for Multi Line format use double carriage return and line feed like \r\n\r\n as the record separator.
Under the log File or Directory field, specify the location that you set the DNS logs to write to.
Click Change Configuration

Windows log filtering
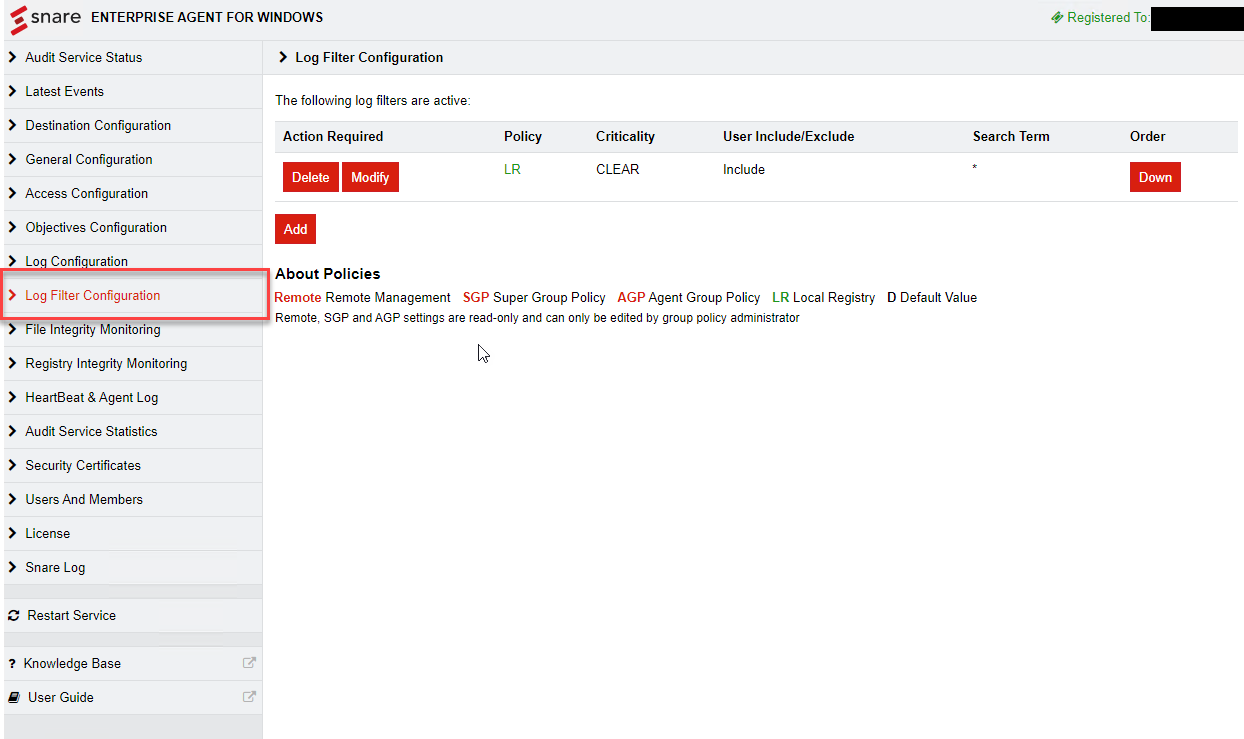
Select Log Filter Configuration from the left hand side menu.
Click add objective
This is where you would add includes or excludes for filtering. By default “*” is in the field.
Click Change Configuration
Click Apply the Latest Audit Configuration
Click Reload Settings

Other DNS logs
Microsoft has other custom event logs that can also contain user activity for the configuration changes to Windows DNS settings.
The Snare enterprise agents can track all access and modification to the DNS settings on Windows and Unix systems.
Here is how you enable DNS logging on Windows:
Use Windows-R to open the run box on the system.
Type eventvwr.msc and tap on the Enter-key to load the Event Viewer.
Navigate the following path: Applications and Service Logs > Microsoft > Windows > DNS Client Events > Operational
Right-click on Operational, and select Enable Log.
The key aspects of the logs that can be collected are:
All user authentication activity. If the user logs into the system either from the local console, Active Directory, or via ssh on Unix then Snare can collect the relevant operating system audit events or kernel events to show that a specific user logged into the system. This data will include the source IP, authentication type, relevant success and failure of the attempt and the date and time stamp of the activity.
Microsoft has technical articles on how to configure your audit policy to generate the specific events both on legacy 2003 and newer 2008R2, 2012R2, 2016 and 2019 systems that support advanced audit policies.
All the events are quite detailed, and include:
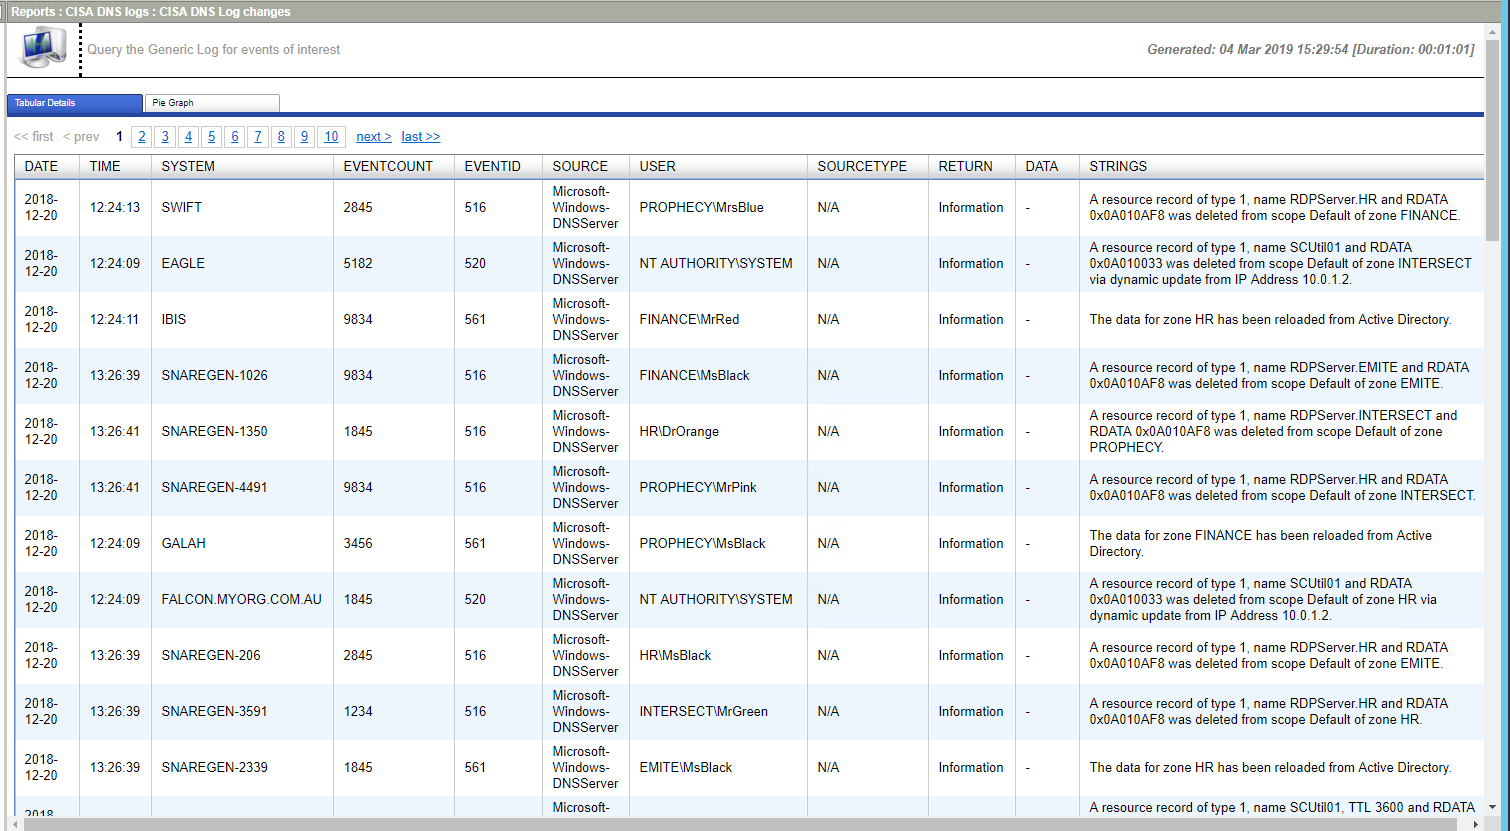
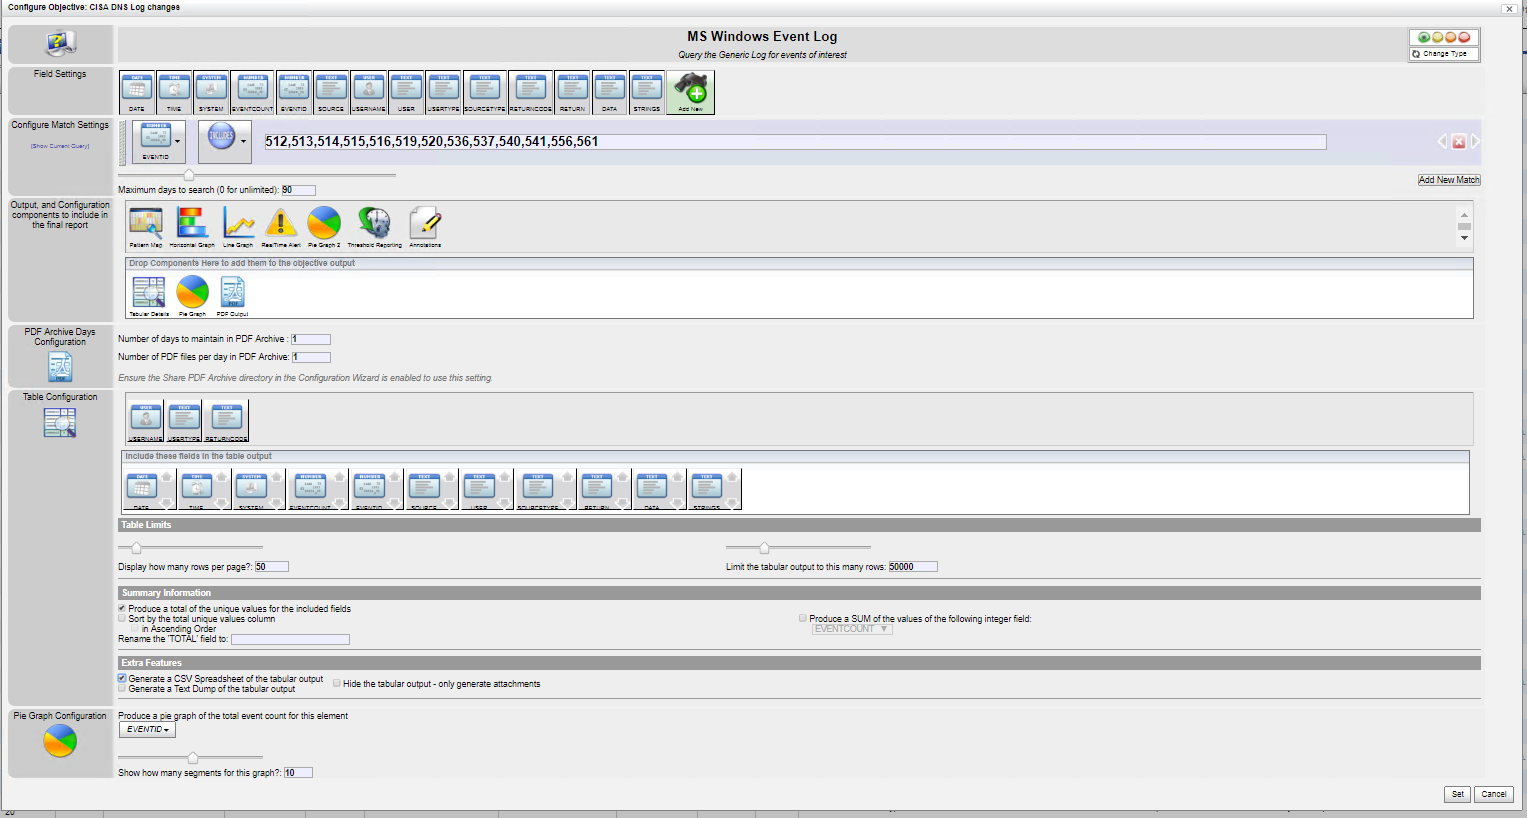
The Microsoft custom event logs on Windows 2008R2, 2012R2, 2016 and 2019 also include DNS Server and DNS client eventlog categories. The Snare agent will collect these using the default objectives. The events collected show additional changes to the DNS records that can occur through either manual or dynamic updates associated with Active Directory DNS and zone files. A summary of the event types are:
512, 513,514,515,516 - ZONE_OP - These can be part of major updates and changes to the zone files.
519,520 DYNAMIC_UPDATE
536 CACHE_OP
537,540,541 Configuration - these events will be the areas of main concern with systems changes.
556 SERVER_OP
561 ZONE_OP
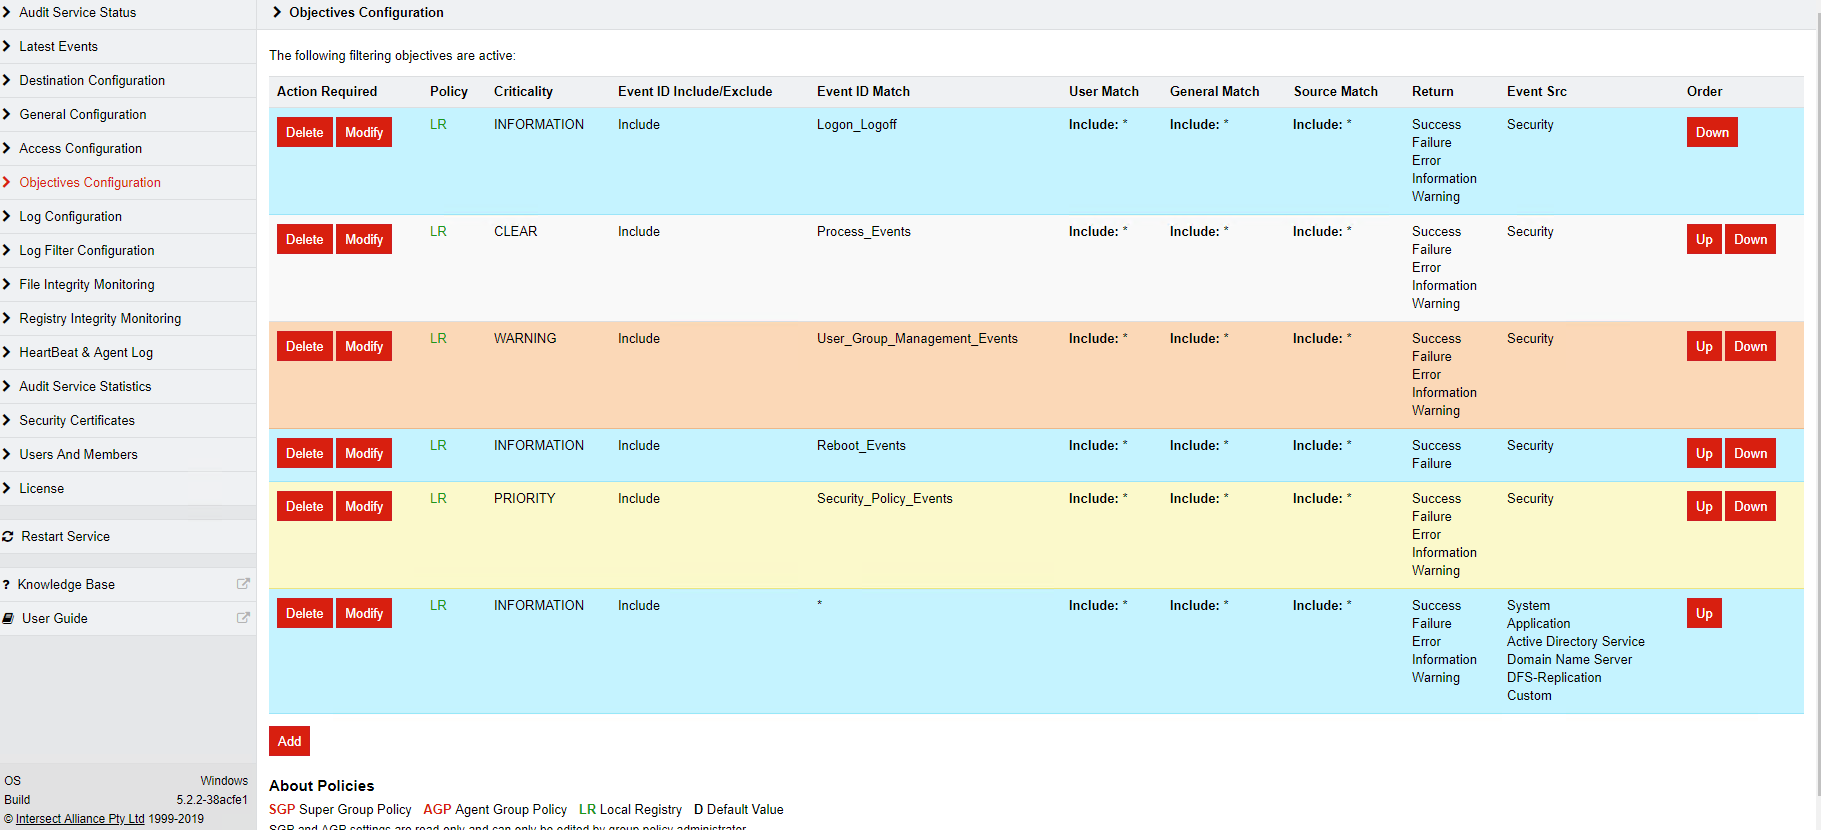
The Snare agent for windows will collect DNS Server logs as part of the default configuration.

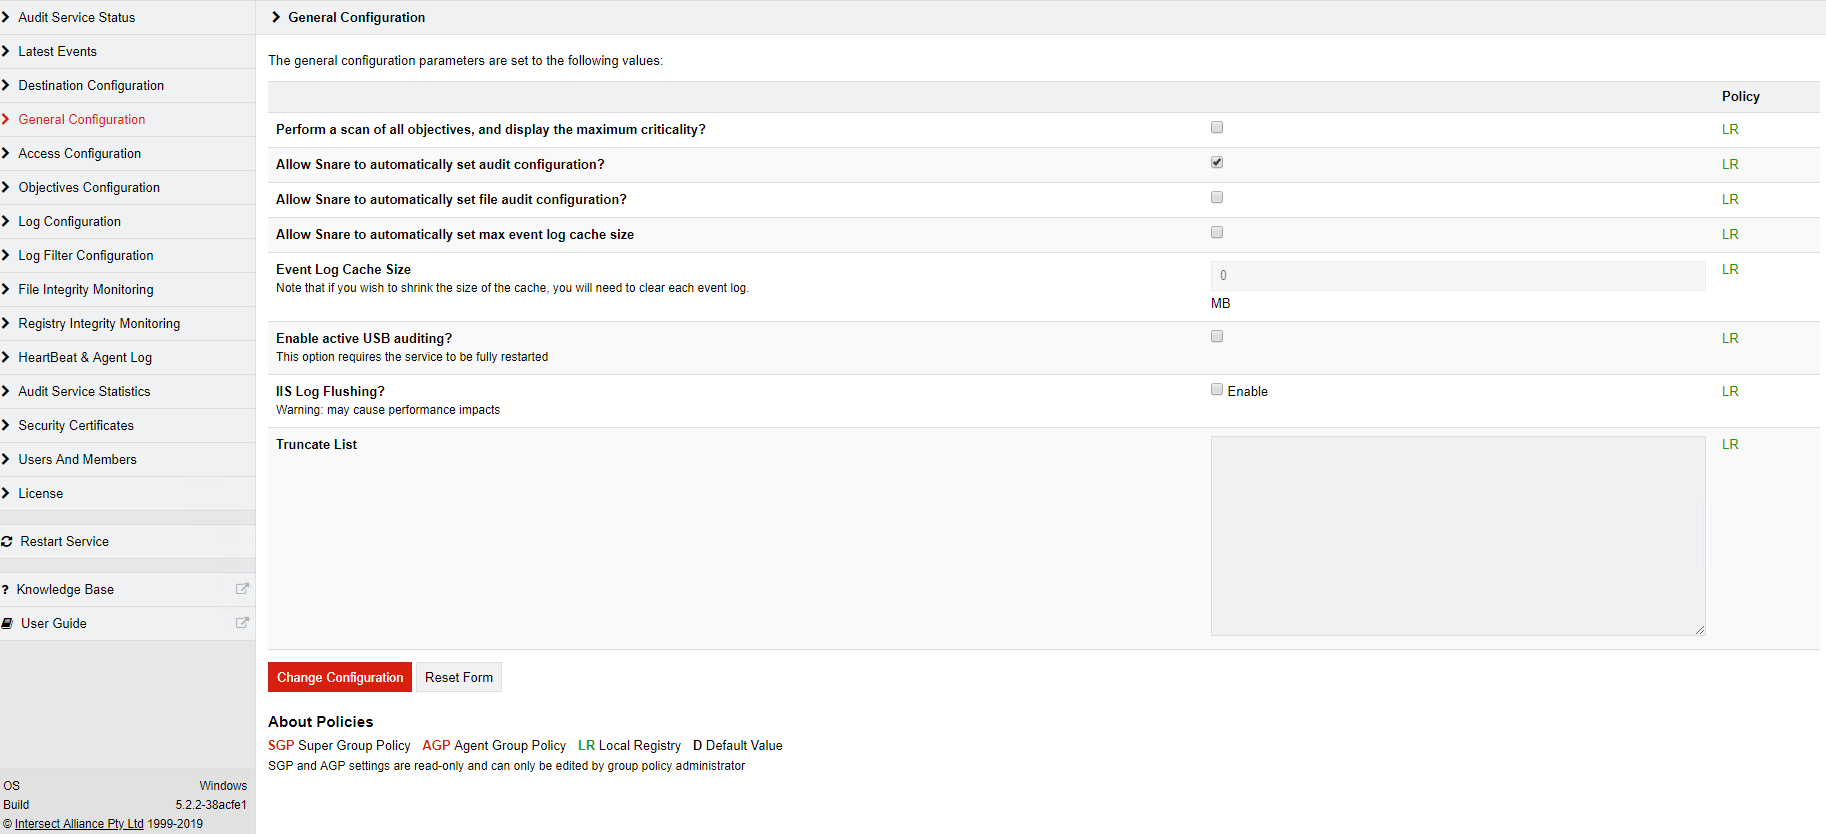
As part of the installation process, the Windows agent can be told to manage the configuration of the Windows audit subsystem, to ensure that it generates the relevant administrative events. Alternatively, the Snare for Windows agent can be configured to be subservient to manually configured local policy or group policy settings. It should be noted that unless the associated audit subsystem is appropriately configured, events may not be delivered to the Snare for Windows agent, for processing.

For Unix systems the the DNS files are usually flat text files. The Snare Linux agent can use two aspects to monitor the files
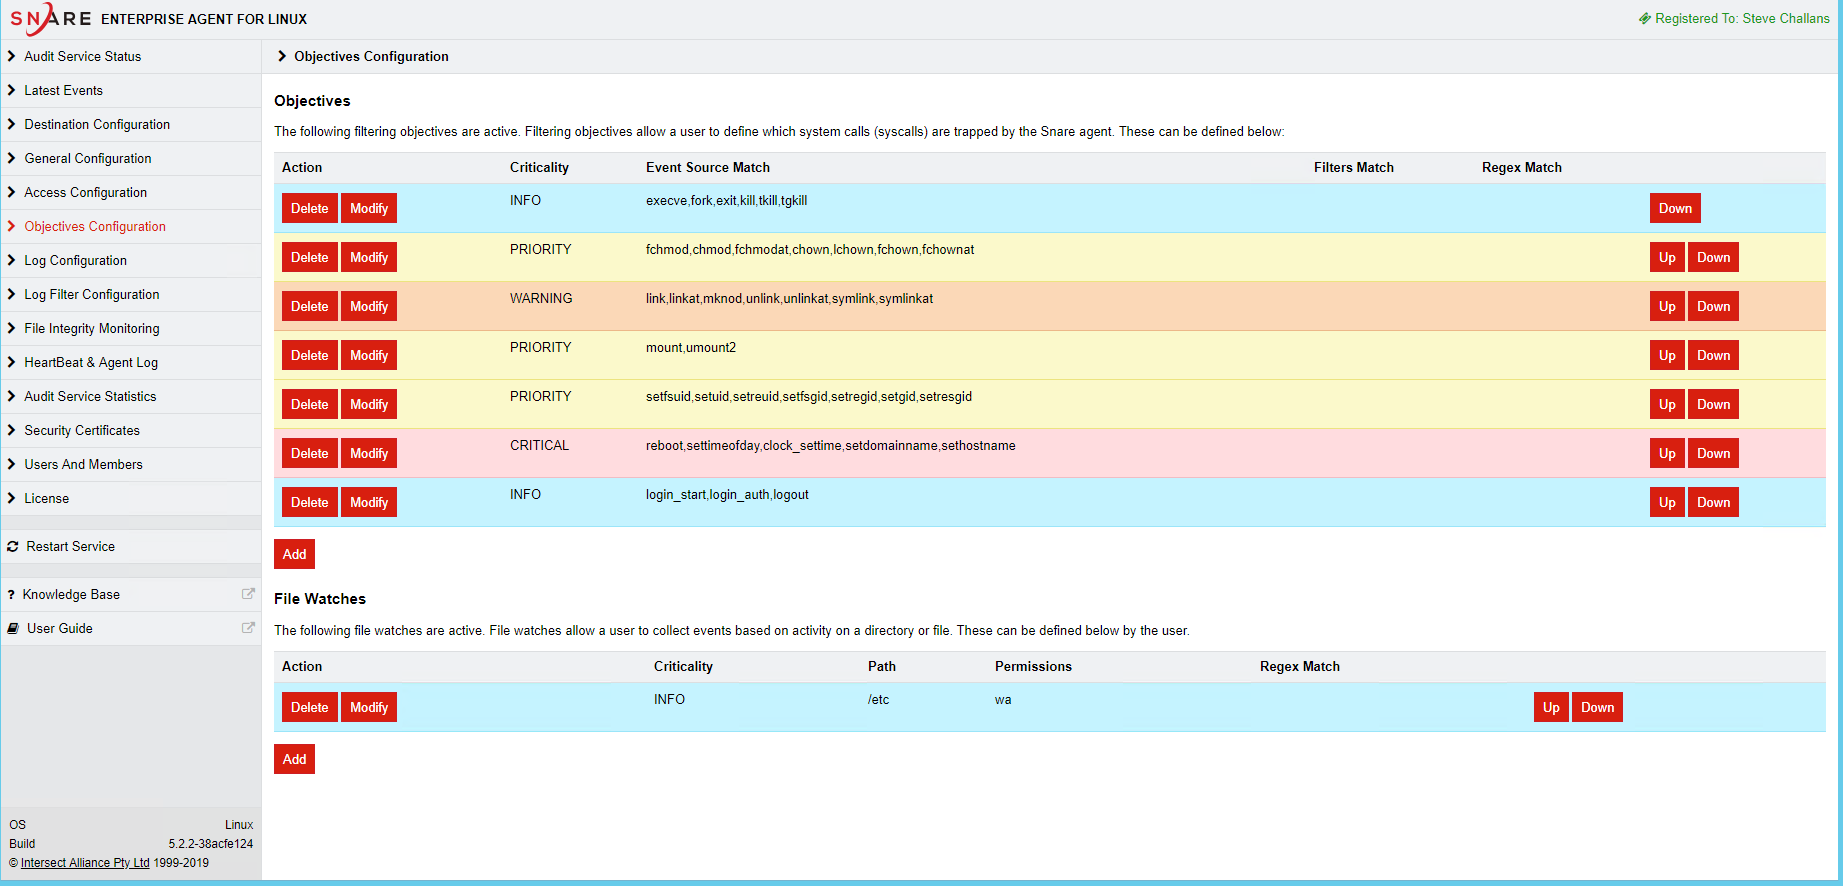
File watches: The agent can be configured to watch for any and all changes to specific files related to DNS configuration settings, and will raise kernel audit events on access or modification, including details of who accessed/changed the file, and date/time information associated with the event. On Linux systems, configuration files related to bind, dnsmasq or other DNS server tools may be monitored.
The default administrative Objectives for the Linux agent, track all user logins, administrative activity, an privileged commands. File watches are also configured for for changes to the /etc directory, which hosts system level configuration files for the operating system.

File Integrity Monitoring - The Snare Linux agent can also perform sha512 checksum operations on system configuration files, such as DNS configuration files, in order to watch for changes. This will track all new files, changes to files or deletion of files and directories being monitored. These events dont show who did the change but will track the actual changes and permission changes to files. The FIM monitoring can be run on a configurable schedule (eg: once per hour or once per day) depending on the level of granularity wanted.
Once the logs have been generated then its up to the SEIM and reporting systems to provide reports or alerts relating to the changes. Snare offers two complimentary method for this:
Using Sysmon for DNS log Enrichment
The Microsoft Sysinternals Sysmon is a valuable tool that helps to log additional information on user activity and process execution. In June 2019 they added a new feature that includes capturing the parameters used on commands and also DNS query logging activity. Sysmon is installed as a service on a windows server and will log activity to a custom windows event log. https://docs.microsoft.com/en-us/sysinternals/downloads/sysmon
As the logs are in the custom event log location and they are standard operational event logs the Snare Windows agent collects them using the out of the box policy settings. There are some 24 event types that Sysmon provides. Event ID 22 is for DNSEvent DNS Query types. This event generates when a process executes a DNS query, whether the result is successful or fails, cached or not. The telemetry for this event was added for Windows 8.1 so it is not available on Windows 7 and earlier.
The DNS event log collection by Sysmon is not the same as the logs collected from Snare Server logs or Debug logs as it provides only client query logging but the information compliments the information from DNS Server and Debug logs by adding the name and path of the application which is querying the DNS Server. It can monitor the DNS queries from almost any windows client software that is running on the network ie web browsers like Chrome, ssh, ping and tracert commands, malware payloads. Commands like nslookup will show up under Event ID 1 and show the event like the following and show the parameters used.
Some good resources for configuring Sysmon can be found here
The sample configuration which starts are line 836 for Event ID 22 for DNS Query covers the basic filtering and setup needs. You can apply this configuration as is or tune it for your specific network and filter out other domains. Install the new configuration XML files by running “sysmon64.exe -c config.xml”.
Once installed you will start to see Event ID 22 showing up which the Snare agent will collect and forward to Snare Central or other SIEM. The DNS event ID 22 will show if the query was successful or unsuccessful, caches or not. The events will show the full domain loop up details as well as the user and command that was doing the DNS lookup.
Filtering of these events can be setup in the agent for the specific custom event location, event id's or strings in the event can be excluded using the normal agent event exclude features.
